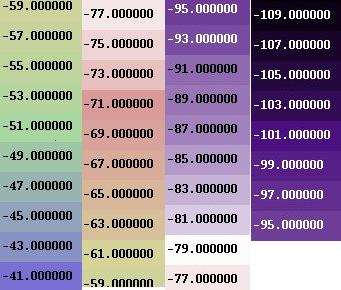
blue shades between -41° and -50°,
green shades to between -51° and -60°,
light-red shades between -61° and -70°
pink shades to between -71° and -80°
violet shades from -80° until -105°
black beyond -105°
The different characteristics of the convective objects are displayed through a multilevel visualisation:
1. The first level corresponds to the superposition of graphical attributes onto the corresponding infrared image.
These graphical attributes are:
a. coloured contour which defines the observed cloud system edges.
The colour of this contour is related to the life-cycle stage of the observed system. More precisely :
yellow contour when the system is detected for the first time ("triggering" of the system) or is in its first development in the lowest levels,
The thickness of this contour is related to the temperature tendency of systems: the greater the cooling, the thicker the contour.
The style of the contour (dashed/plain) indicates which method has been applied to diagnose the convective nature of the system :
b. yellow line shows the trajectory of the system (all previous locations of the centre of gravity of the system in past images).
c. black arrow shows the expected move of the system for the next half hour
2. The second level allows to access to numerical
values of some characteristics of the cloud system..
These values are displayed into an interactive window. Its visualisation is activated by moving the mouse inside the contour of the corresponding cloud system.
3. The third level allows to visualise time series of past evolution of the following characteristics of the cloud system :
a. When available, Number of positive and negative lightning impacts registered below the convective system,
b. Area of the system at different brightness temperature thresholds
c. Thresholding and minimum brightness temperature of the system.The visualisation of these series is also interactive and is activated by simple-click inside the contour of the corresponding cloud system.
The horizontal axis of these time series is graduated in hours. For 30min-advected RDT, 0 corresponds to time of validity , and -0.5 to observed time
|